Statistics
How to check the statistics of your trades
How to check the statistics of your trades
PersonalTrader offers several reports that you can check to monitor the results of your trades and strategies. All statistics provided are in real-time.
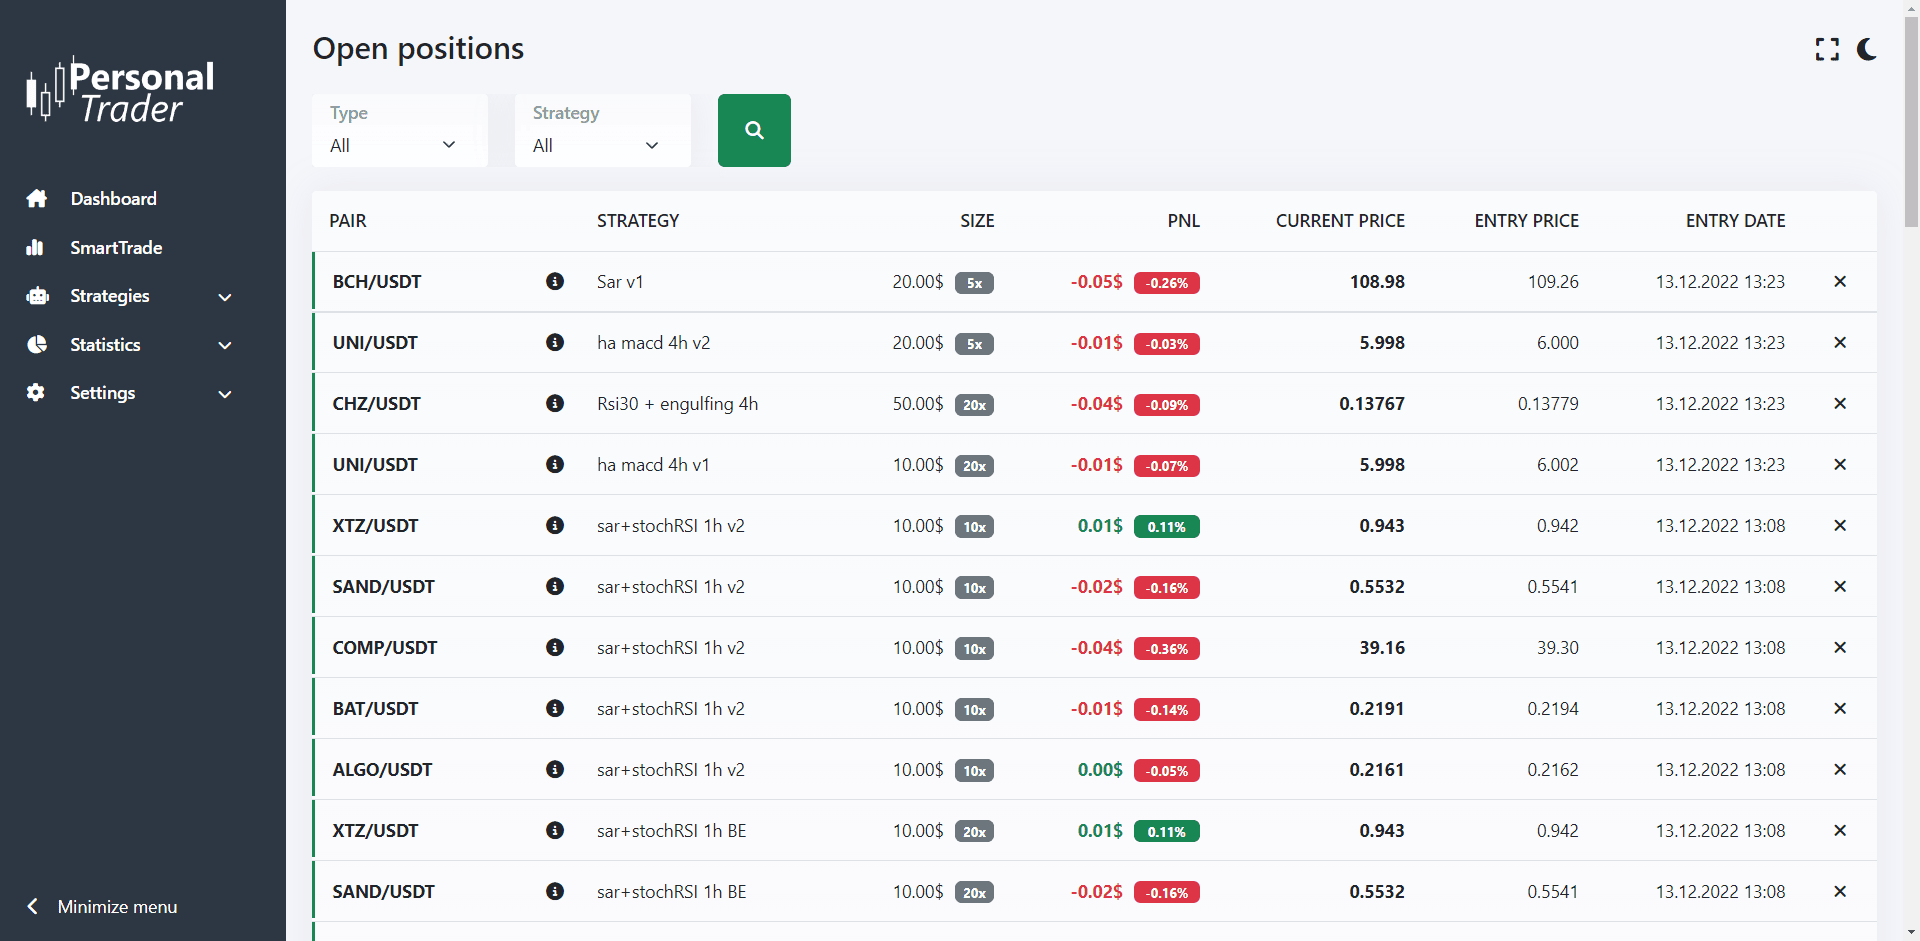
Open Positions
In this page you can see all the trades that are currently opened with PersonalTrader, both on paper and on an exchange. Each row corresponds to a different trade. All information shown are automatically updated every 5 seconds.
Use the search filters on the top of the page to only show a particular strategy (including SmartTrade) or a particular type of trade (paper trades or real trades).
If you click on the info icon you will see more details about that trade. Including take profit, stop-loss, and if enabled, break-even and lock profits.
If you click on the close icon located on the right, you can manually close a trade. If it’s a real trade (opened on an exchange) it will be closed on the exchange too (at market price).
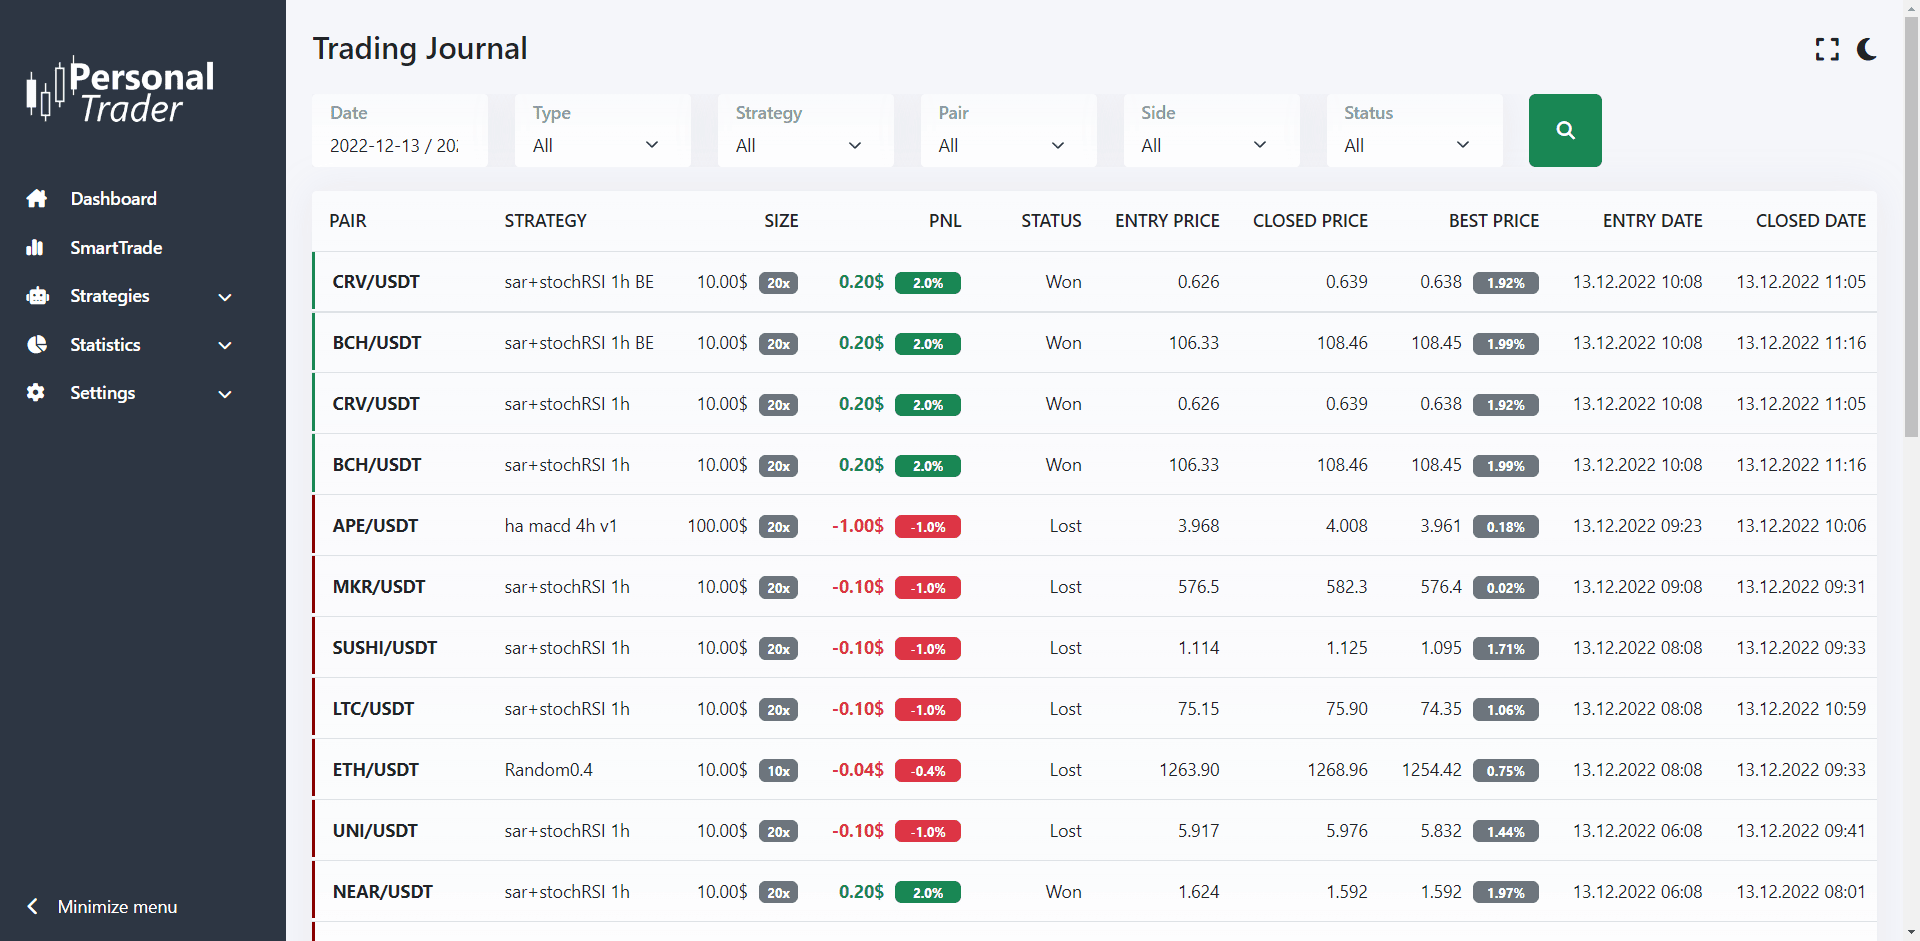
Trading Journal
No need to manually keep your trading journal, PersonalTrader does that for you! In this page you can see all the trades that has been made with PersonalTrader, both on paper and on an exchange. Each row corresponds to a different trade.
Use the search filters on the top of the page to only show trades made on a specific period, a particular strategy (including SmartTrade) or a particular type of trade (paper trades or real trades).
If you click on the trash icon located on the right, you can permanently delete a trade from your journal.
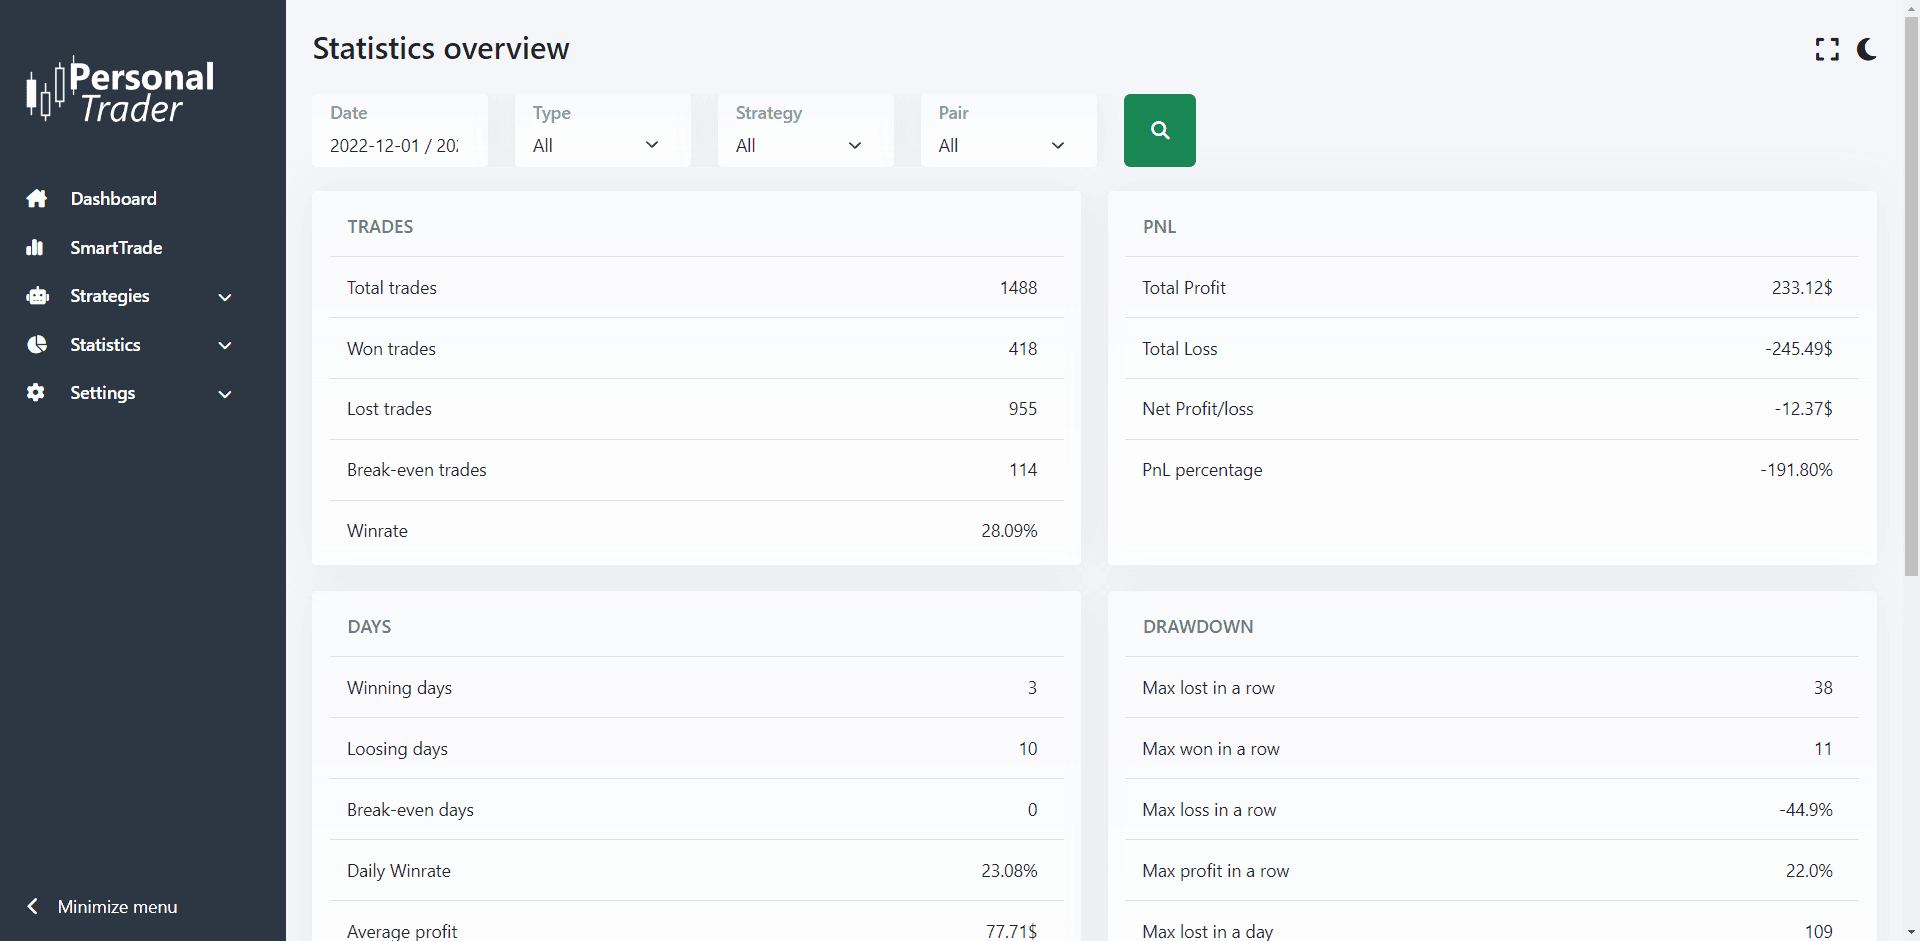
Statistics overview
In this page you can see a detailed overview of all the trades that has been made with PersonalTrader, both on paper and on an exchange.
Use the search filters on the top of the page to only show trades made on a specific period, a particular strategy (including SmartTrade) or a particular type of trade (paper trades or real trades).
Each section of this page will show you interesting statistics, such as: your PnL (profit and loss), the number of trades made, won and lost, the win-rate ratio, the maximum number trades won and lost in a row (drawdown), the duration of your trades, and much more.
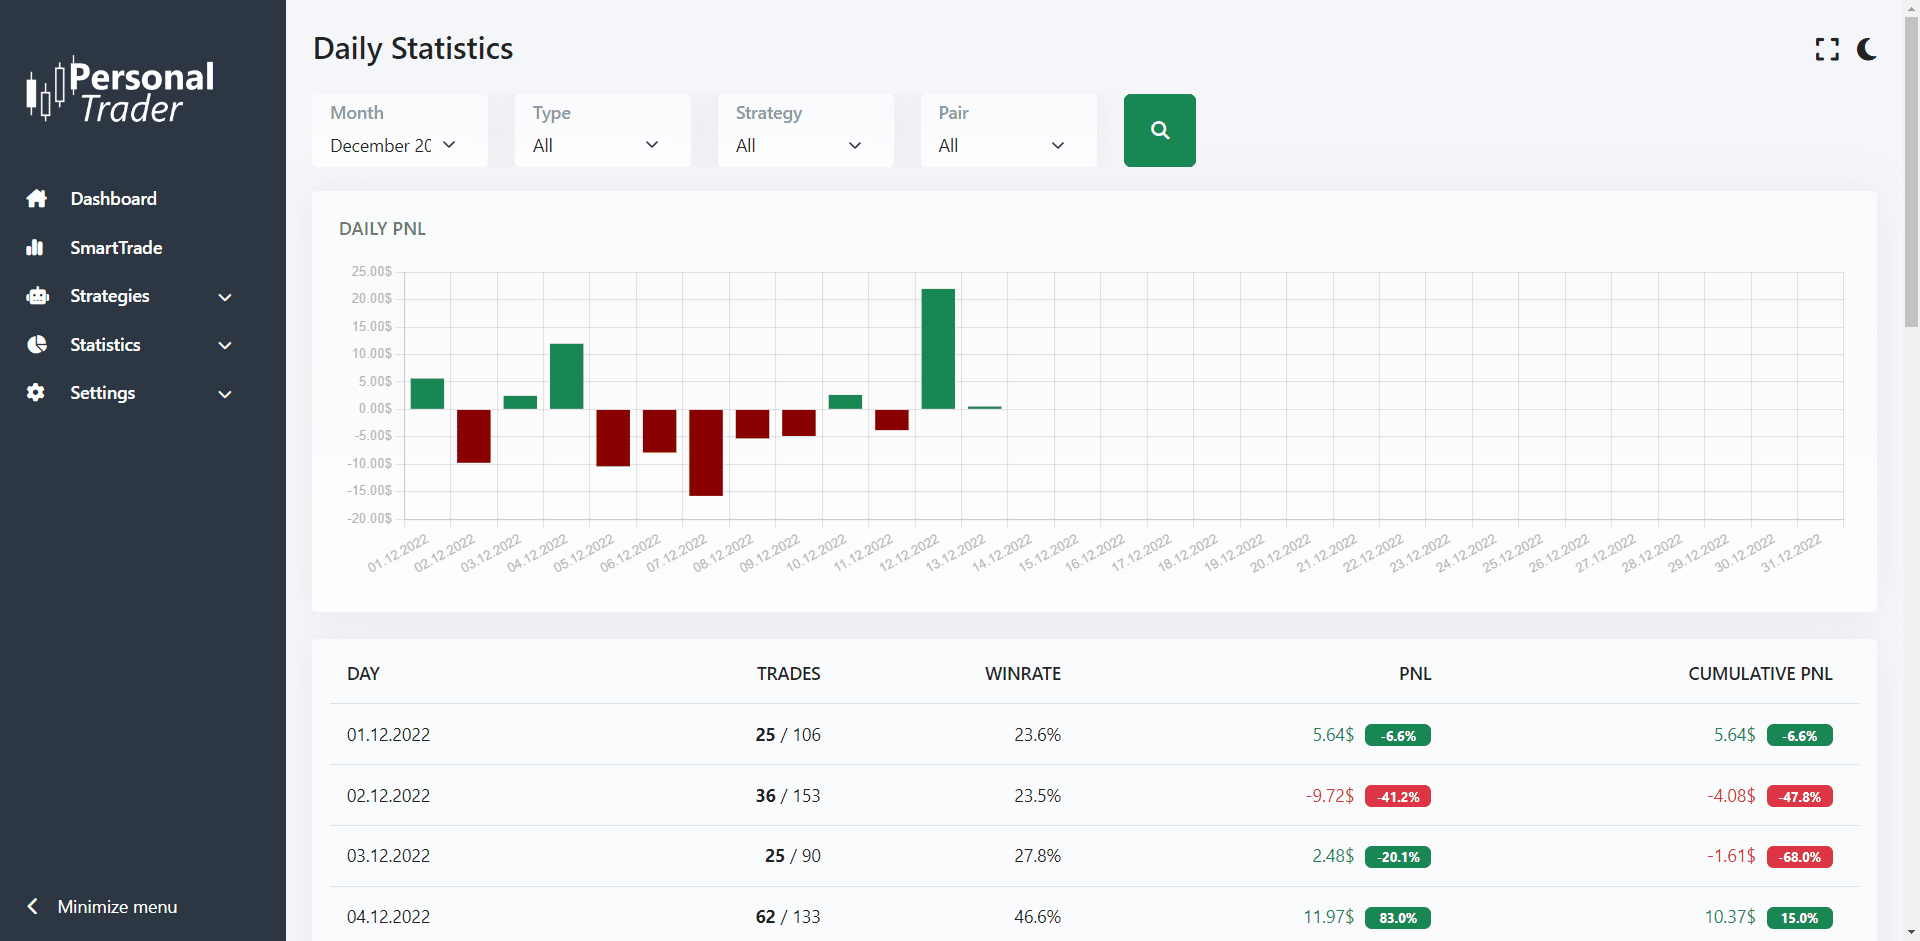
Daily report
In this page you can see the daily statistics of the trades you made within a selected month.
Use the search filters on the top of the page to only show statistics of a specific month, a particular strategy (including SmartTrade) or a particular type of trade (paper trades or real trades).
Right below there is a chart, that will show you how much you won (in green) or lost (in red) each day of the selected month. If you click on a bar you will see more details about that day.
The table will show you how each day has performed, with interesting details like: Number of trades won, number of trades made, win-rate ratio, daily PnL (profit and loss) and cumulative PnL.
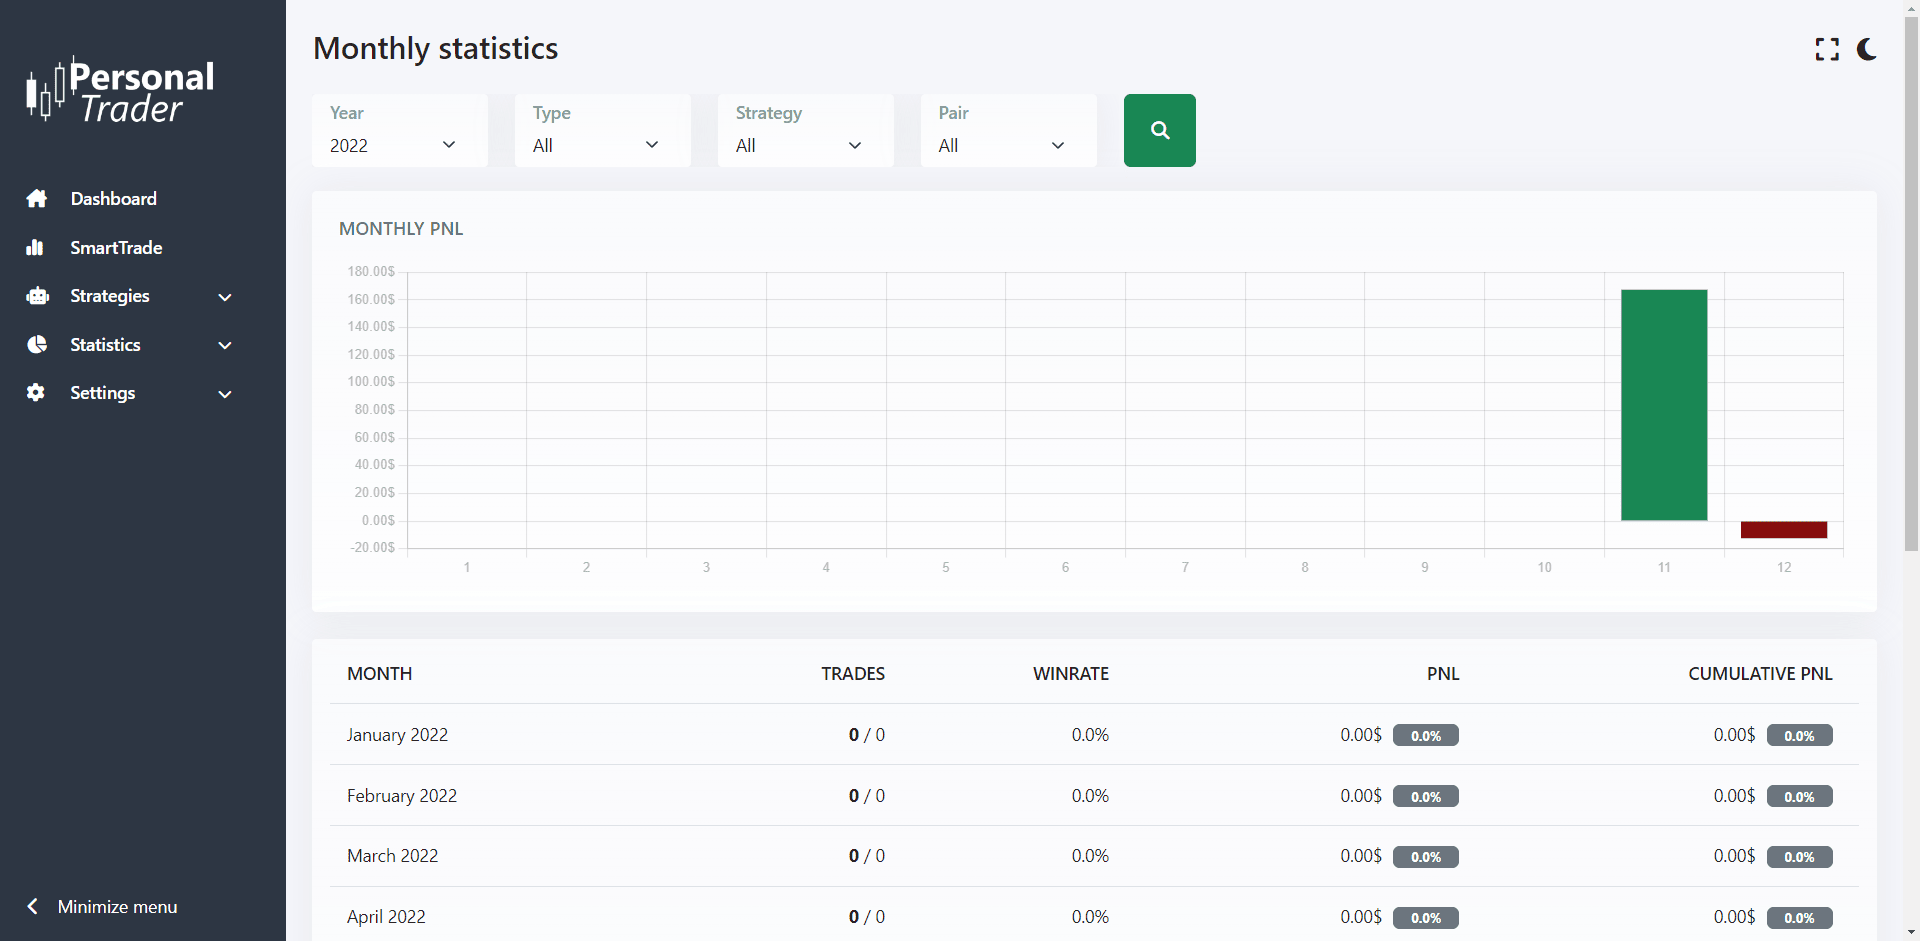
Monthly report
In this page you can see the monthly statistics of the trades you made within a selected year.
Use the search filters on the top of the page to only show statistics of a specific year, a particular strategy (including SmartTrade) or a particular type of trade (paper trades or real trades).
Right below there is a chart, that will show you how much you won (in green) or lost (in red) each month of the selected year. If you click on a bar you will see more details about that month.
The table will show you how each month has performed, with interesting details like: Number of trades won, number of trades made, win-rate ratio, monthly PnL (profit and loss) and cumulative PnL.
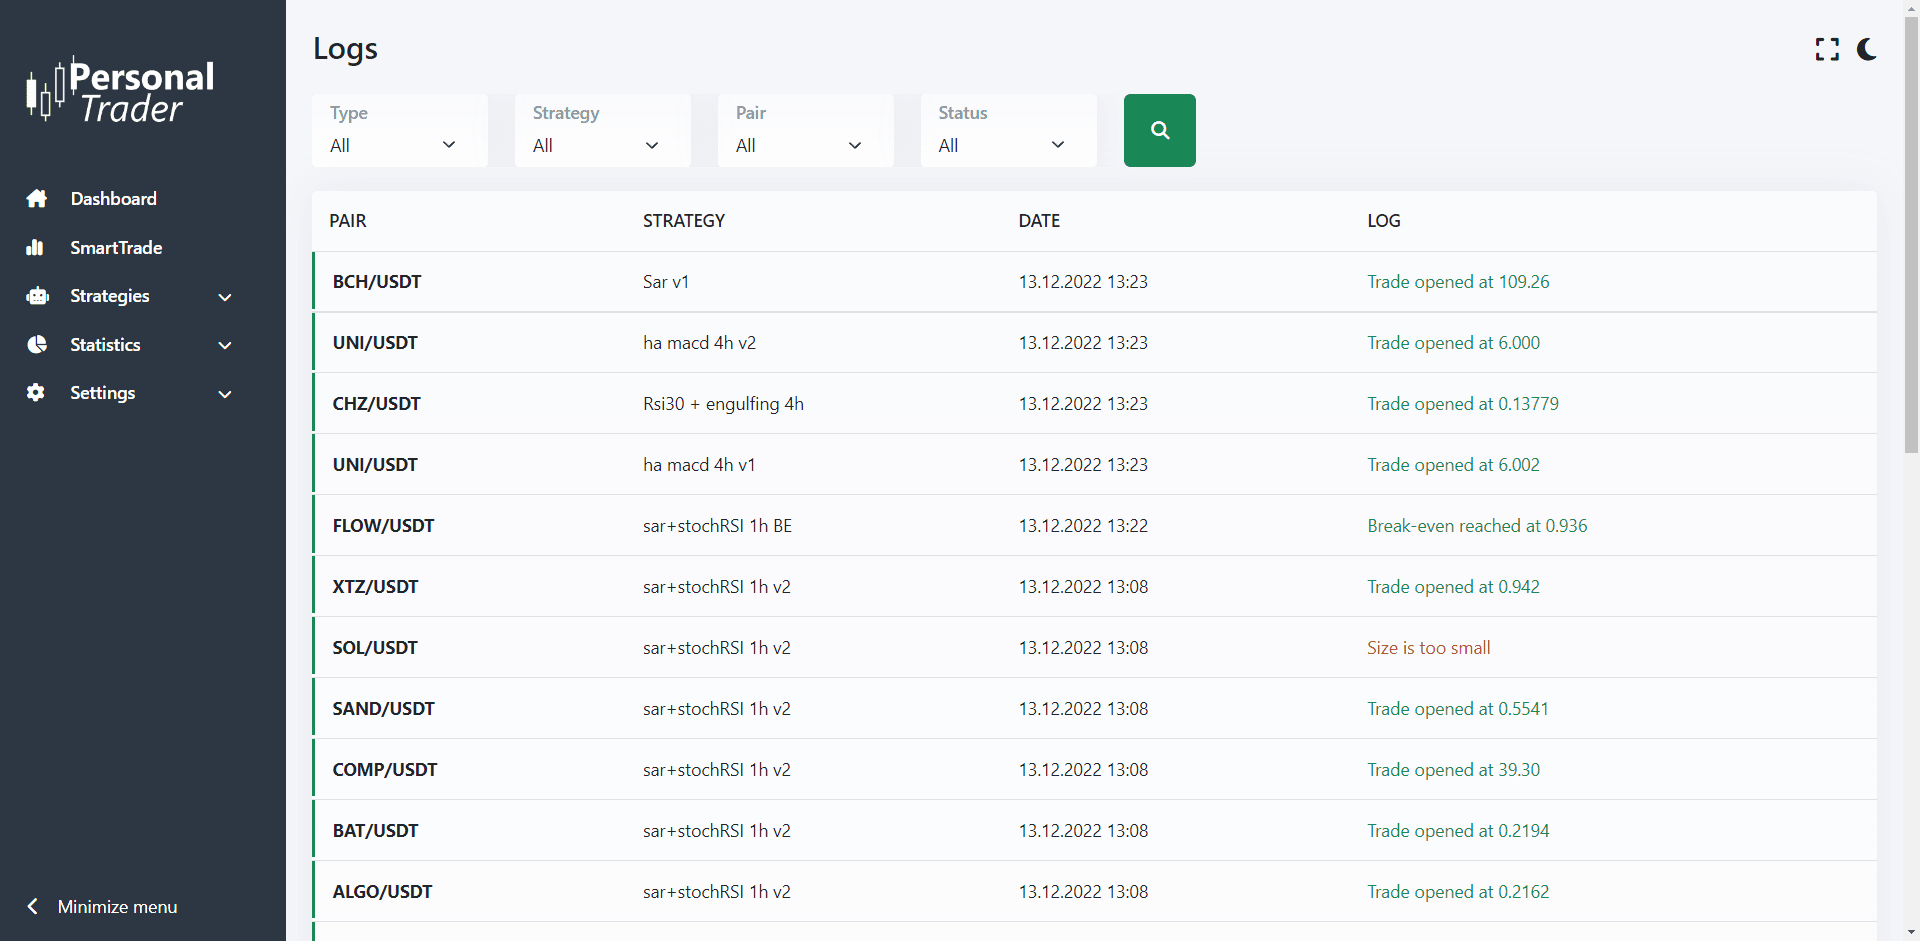
Logs
In this page are shown all the actions performed by PersonalTrader. For example, the log show when a new trade is opened, when it’s closed, if it has reached the stop-loss or the take profit.
Use the search filters on the top of the page to only show the logs of a particular strategy (including SmartTrade) or a particular type of trade (paper trades or real trades).
For real trades, you can click on the down-arrow icon to see all the actions performed on the exchange via API.
If the text color is green, that action was performed without errors. If the text color is red, an error has occurred while performing that action.
You can select to show all statistics with or without Exchange Fees and with or without Leverage. These options are available in: Settings > General Settings