Dashboard
How to use the Dashboard of PersonalTrader
How to use the Dashboard of PersonalTrader
When you log in to PersonalTrader you will see your Dashboard. All information shown in the dashboard are explained below and are automatically updated every 5 seconds.
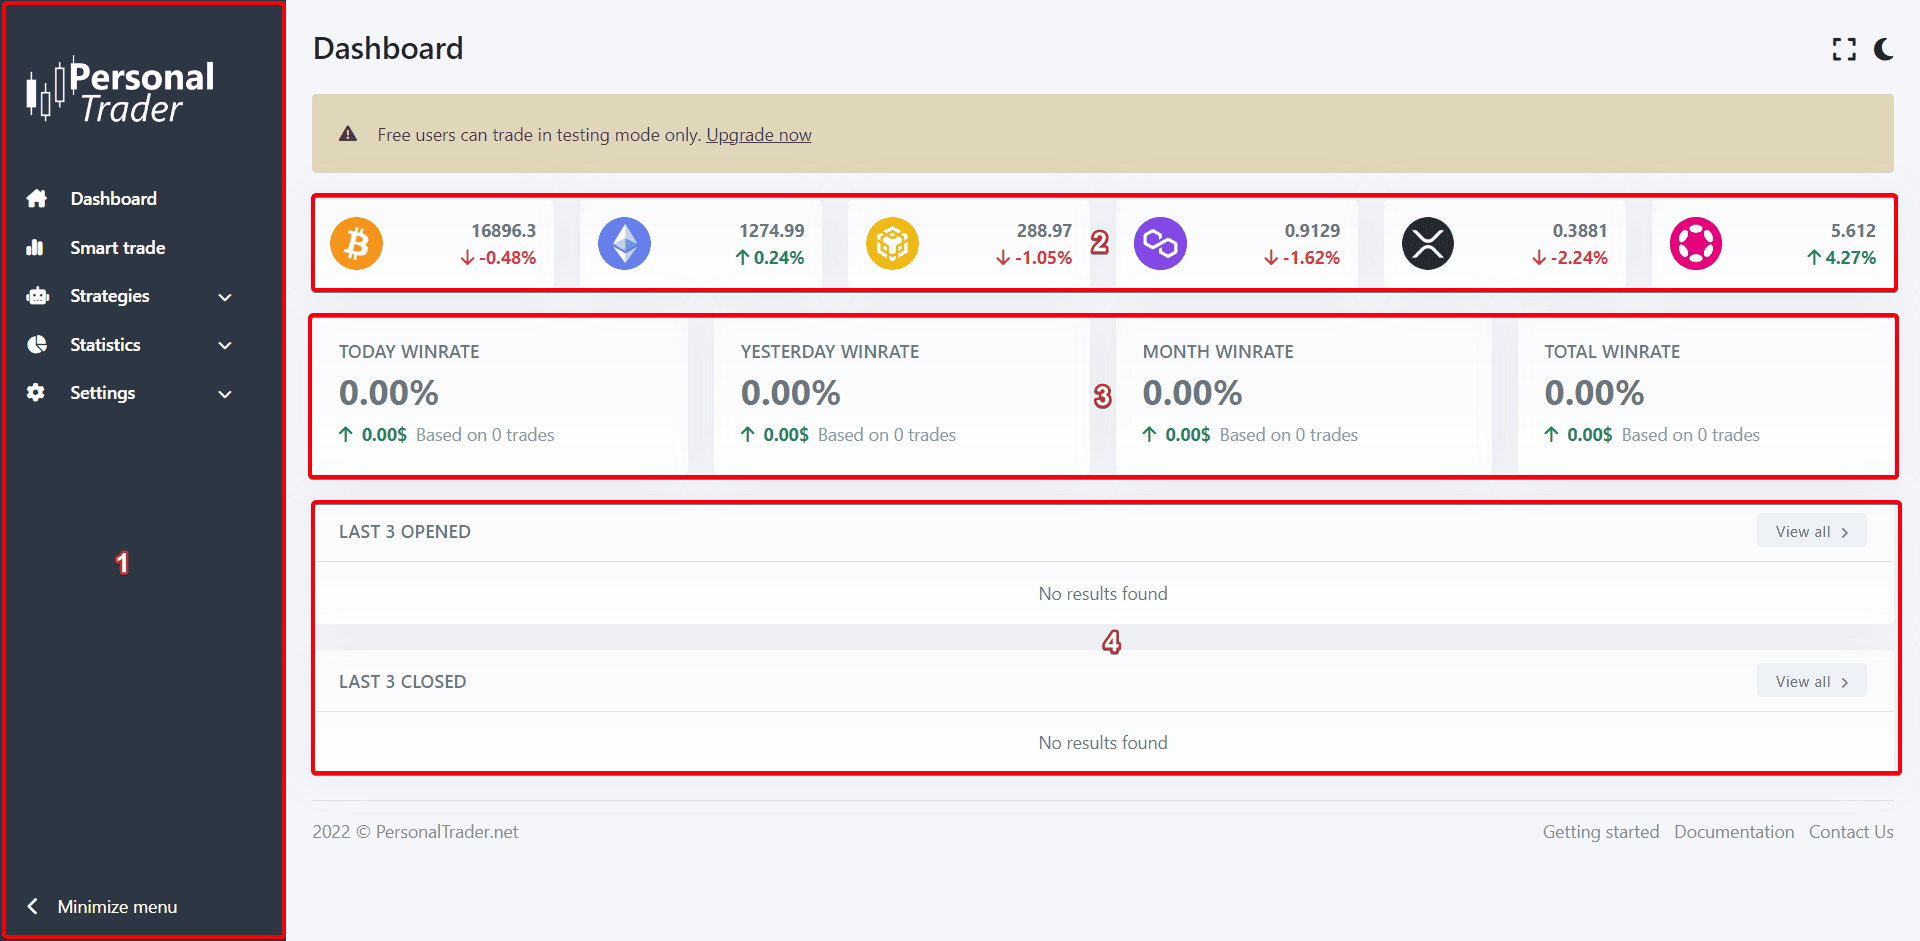
1. Main menu
On the left side of each page, there is the main menu. You can use it to navigate among all the sections available in PersonalTrader. If you are using a smartphone, the menu is located on the top left corner of each page.
2. Cryptocurrencies
At the top right of your dashboard, you can see the prices of your favorites 6 cryptocurrencies, and the related price changes. You can customize what cryptocurrencies are shown and the price changes period (15 minutes, 1 hour, 4 hours or 24 hours), from: Settings > Dashboard settings.
3. Statistics overview
Right below you can see the statistics of all your trades and strategies. There are 4 sections that contains the statistics of: today, yesterday, current month and total (from the beginning). In each section you will see your win-rate, PnL (profit and loss) and the number of trades made in that period.
4. Last trades
In the dashboard you can also see the last 3 trades that are currently opened, and the last 3 trades closed. Click the “View all” button on the right to see all opened or closed trades. If you have a paid plan, you can select to show all trades (paper trades and real trades) or only the real trades, from: Settings > Dashboard settings.